Evaluation of body weight/body mass index as a predictor of dengue severity in children
Body weight/BMI as a predictor of dengue severity
 Crossmark
Accepted : 2025-10-26
Online : 2025-10-31
Print : 2025-10-31


Full text
Abstract
Higher body mass index (BMI) is a risk factor for many non-communicable diseases and certain infectious diseases. Very less evidence is available that links body mass with dengue severity especially in children. The aim of this study was to evaluate any association between body weight/body mass index of children with severity of dengue illness. A retrospective, medical-records based observational study was conducted on 100 dengue-infected children in the age group of 2-15 years between August and October 2023. Dengue serology, complete blood picture, liver enzymes and coagulation profile were noted along with recording of anthropometric parameters like height and weight at the time of admission. Based on clinical presentation, patients were classified as severe and non-severe dengue. Most of the admitted dengue infected children belonged to underweight (67%) and normal weight (27%) category. The patients were divided into 2 groups: Group 1 included patients in the age group of 2-5 years where the independent variable considered was z-score for weight-for-age and Group 2 included patients between >5-15 years where z-score for BMI-for-age was taken as independent variable. Binomial logistic regression analysis was done to correctly classify the cases as non-severe and severe based on z-scores of weight-for-age / BMI-for-age (independent variable) of the effected children which was statistically significant in group 2 (p=0.000). The model correctly classified 61.8% of cases in group 1 and 86.4% of cases in group 2. Though the majority of cases were in underweight or normal weight category, the results indicate that those with higher weight and BMI for their age and gender are more likely to develop severe dengue infection.
Keywords: Body mass index, Body weight, Dengue, Nutritional status, Underweight
How to cite: Hadi MA, Arifuddin MS, Hazari MA. Evaluation of body weight/body mass index as a predictor of dengue severity in children. Ann Med Physiol. 2025;8(1):7-13. doi: 10.23921/amp.2025v8i1.00076
Introduction
Dengue is a globally pervasive arthropod borne disease, caused by dengue virus of Flaviviridae family. The primary vectors responsible for its transmission are Aedes aegypti and to lesser extent, Aedes albopictus mosquitoes. Dengue infection is prevalent in tropical and subtropical countries in the world, with an estimate of nearly 390 million cases occurring yearly across the globe [1]. Dengue virus exists in four diverse serotypes, denoted as DENV-1, DENV-2, DENV-3 and DENV-4. It has been observed that immunization against specific serotype or occurrence of natural infection renders the effected individual immune for life for that serotype whereas immunoprotection with the other dengue serotypes is temporary [2].
Previously, World Health Organization (WHO) in the year 1997 had classified dengue based on clinical signs and symptoms into dengue fever, dengue hemorrhagic fever and dengue shock syndrome. In 2009, WHO re-classified dengue based on severity of the disease and rate of its progression into 3 groups: Dengue without warning signs, Dengue with warning signs and Severe dengue [3].
Obesity, an alarming health issue both in developed and developing countries, stands out as an important risk factor not only for non-communicable diseases but also for certain infectious diseases. Obesity has been reported to negatively impact immune system, respiratory system and circulatory system, making the individual more prone for infectious diseases, which is associated with unfavorable prognosis and high mortality. In dengue hemorrhagic fever, there is a pronounced phenomenon of plasma extravasation, which can precipitate hypovolemic shock, ultimately leading to Dengue Shock Syndrome (DSS). Excessive white adipose tissue in obese individuals leads to increased release of interleukins (ILs) and tumor necrosis factor - alpha (TNF-α). One of the effects of TNF-α is to increase permeability of capillaries. High levels of TNF-α in obese dengue patients is assumed to cause massive leakage of plasma leading to lethal complications like multiorgan failure, a feature of Dengue Shock Syndrome (DSS).
Limited evidence is available that links body mass with severity of dengue infection especially in children. Since obesity predisposes to increase in plasma leakage during dengue infection, it can be hypothesized that dengue infected children with higher body mass can develop severe dengue and is logically apt to account for body weight during management of the disease symptoms [4].
The aim of this study was to investigate any association between body weight/body mass index (BMI) in children and occurrence of severe dengue infection, with a focus on understanding how varying BMI levels influence disease outcome.
Materials and methods
A retrospective medical-record based observational study was conducted in a teaching hospital of Hyderabad, Telangana.
Patients
Inclusion criteria
In-patient dengue cases (confirmed clinically) treated in pediatric ward between August and October 2023 in the age group of 2-15 years, inclusive of both genders with NS1 antigen positive (done if admitted within 5 days of onset of fever) and IgM antibody positive (done if admitted after 5 days of onset of fever).
Exclusion criteria
All incomplete case records/case sheets, case with prior history of liver disease, case which developed co-infection during the course of hospital stay were not included in this study.
Methods
This study was conducted after obtaining prior approval from the Institutional Review Board (IRB) (IRB No.: 2024/45/003). Since this was based on medical records, informed consent was not required.
Sample size: Convenience sampling method was used. A total of 100 dengue-infected children data fulfilling the inclusion criteria were enrolled who were admitted between August 2023 and October 2023. This duration coincided with the peak in dengue cases in our area.
Case sheets were analyzed for dengue serology, complete blood picture, liver enzymes and coagulation profile done at the time of admission. Case sheets were also analyzed for presence or absence of warning signs during the course of hospital stay like respiratory distress, ascites and shock. Data was entered in Microsoft excel sheet. The patient's height and weight that were recorded at the time of admission and documented in case sheets were noted and the body mass index was calculated:
The patients’ nutritional status was assessed with Indian Academy of Pediatrics (IAP) growth charts. Overweight and obese were defined at 23 kg/m2 and 27 kg/m2 respectively using these charts [5]. Since BMI was considered a better index in children above 5 years [5,6], the study participants were divided into 2 groups based on their age: Group 1 included children between the age of 2-5 years and Group 2 included children between >5-15 years.
Depending on clinical presentation and altered laboratory parameters, patients were classified as severe and non-severe dengue. The criteria for severe dengue included presence of the following:
- Severe plasma leakage (like pleural effusion, ascites) that can lead to dengue shock syndrome or/and respiratory distress,
- Severe bleeding accompanied by very low platelet count,
- Severe organ involvement (impaired liver function, renal function or involvement of other organs) [7].
Statistical analyses
Microsoft Excel sheet was used to enter the data and was imported into SPSS 17.0 version (IBM SPSS Inc., Chicago, USA) for analysis.
Since the linear growth and increase in weight varies with age and gender, for comparabilty across different ages and gender, z-scores were calculated using SPSS macros for 0-5 years and 6-19 years by running SPSS syntax files igrowup.sps and who2007.sps respectively [8]. The following z-score parameters were calculated: z-score for height-for-age, z-score for weight-for-age, z-score for weight-for-height and z-score for BMI-for-age. z-score for height-for-age is calculated only upto 5 years of age and z-score for weight-for-age could be calculated upto 10 years of age by the above SPSS macros.
Qualitative variables are presented as numbers and percentages where as quantitative variables are presented as means and standard deviations. To estimate the probability of having severe dengue or not, binomial logistic regression analysis was used. If the estimated probability of the event (in this case, having severe dengue) occurring is greater than or equal to 0.5 (better than even chance), statistical tool classified the event as occurring (e.g., severe dengue being present). If the probability is less than 0.5, statistical tool classified the event as not occurring (e.g., non-severe dengue). Binomial logistic regression analysis was used to predict whether cases can be correctly classified or predicted from the independent variables (z-score for weight-for-age in 2-5 years children and z-score for BMI-for-age in >5-18 years) and also to assess the effect of these variables on the severity of dengue. Model fitness was determined with the Omnibus test of model coefficients. Statistical significance was fixed at p<0.05.
Results
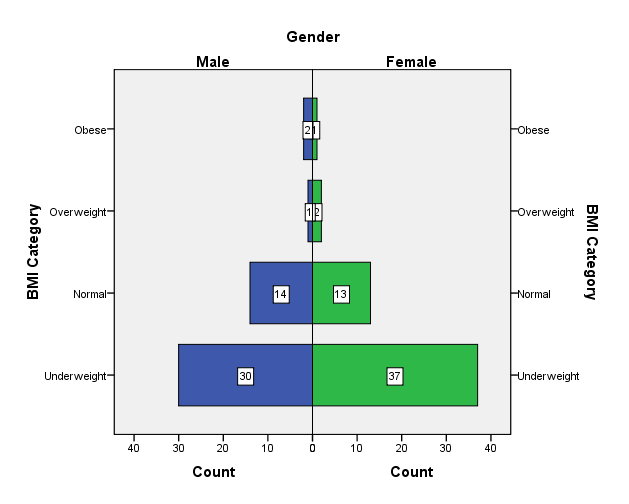
This study included a total of 100 children with dengue infection (as confirmed by NS1 antigen positivity with or without IgM positive report) and admitted in pediatric ward during August-October 2023. Table 1 and Table 2 shows mean values of age, anthropometric parameters, blood parameters measured at the time of their admission in the hospital (as given in their medical record). 67% of underweight and 27% normal weight children presented with dengue. Figure 1 shows distribution of patients according to BMI categories.
| Parameter | Male (n=47) | Female (n=53) | |
|---|---|---|---|
| Data is presented as Mean±SD | |||
| Age (in years) | 7.00±3.65 | 7.45±3.90 | |
| Weight (in kg) | 26.23±17.37 | 25.89±13.53 | |
| Height (in cm) | 118.34±24.06 | 119.81±25.02 | |
| Body mass index (in kg/m2) [5] | Underweight (<18) | 14.62±1.91 (n=30) | 15.17±1.62 (n=37) |
| Normal (18-23) | 20.24±1.59 (n=14) | 19.91±1.54 (n=13) | |
| Overweight (>23-27) | 26.64±0.00 (n=1) | 23.91±1.10 (n=2) | |
| Obese (>27) | 31.32±0.43 (n=2) | 27.53±0.00 (n=1) | |
| Parameter | Male (n=47) | Female (n=53) | p value |
|---|---|---|---|
| Data is presented as n(%) or Mean±SD | |||
| Dengue IgM antibodies positivity | 13(27.66%) | 18(33.96%) | 0.498 |
| Dengue IgG antibodies positivity | 03(6.38%) | 04(7.55%) | 0.830 |
| C-reactive protein (mg/dl) | 13.32±10.88 | 15.39±17.63 | 0.489 |
| Hemoglobin (gm/dl) | 12.16±1.53 | 11.98±1.57 | 0.550 |
| Red blood cell count (million/mm3) | 4.75±0.47 | 4.67±0.60 | 0.467 |
| White blood cell count (/mm3) | 5919.57±3293.96 | 6123.21±3609.62 | 0.770 |
| Neutrophils (%) | 44.89±16.30 | 42.98±17.38 | 0.573 |
| Platelet count (/mm3) | 148468.09±119780.21 | 134716.98±102480.46 | 0.538 |
| SGOT (U/L) | 112.30±86.38 | 123.96±111.73 | 0.564 |
| SGPT (U/L) | 74.38±73.81 | 70.30±62.96 | 0.766 |
| Alkaline phosphatase (U/L) | 200.55±100.26 | 185.21±94.05 | 0.432 |
| PT (sec) | 15.78±2.41 | 13.98±4.65 | 0.134 |
| APTT (sec) | 40.83±5.36 | 40.71±10.98 | 0.965 |
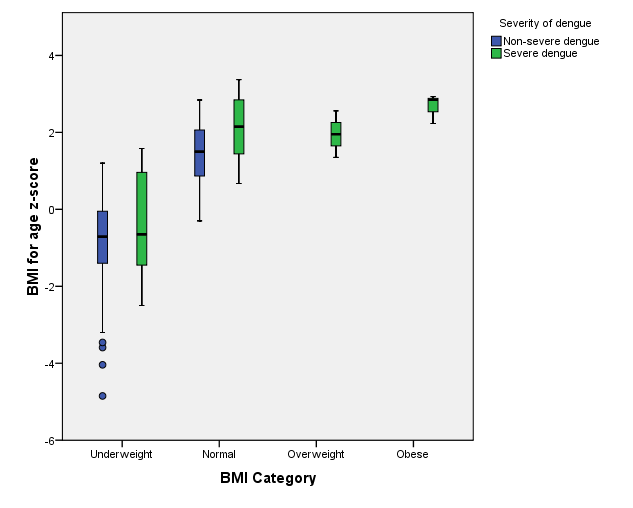
The difference with respect to severity of dengue in z-score for BMI-for-age between different BMI category is shown in Figure 2. Most of the dengue effected patients belonged to underweight and normal weight categories.
| Parameters | Non-severe dengue (n=60) | Severe dengue (n=40) | p value |
|---|---|---|---|
| z-score for Height-for-age (Only for 2-5 years age) | -0.58±1.72 (n=21) | -1.33±0.67 (n=13) | 0.086 |
| z-score for Weight-for-age (Only for 2-10 years age) | -0.57±1.41 (n=49) | 0.29±1.42 (n=28) | 0.013 |
| z-score for Weight-for-height | -0.13±1.42 (n=60) | -0.03±1.62 (n=40) | 0.737 |
| z-score for BMI-for-age | -0.66±1.48 (n=60) | 1.23±1.61 (n=40) | 0.000 |
Statistically significant difference was noted between non-severe and severe dengue with respect to z-scores for weight-for-age and BMI-for age but no such statistically significant difference was noted in z-scores for height-for-age and weight-for-height ( Table 3 ).
Since, body weight is considered a better index of nutritional status in children of 0-5 years age group and BMI a better indicator for nutritional status for >5-19 years age group [5,6], binomial logistic regression analysis was done after dividing the cases into 2 groups:
- Group 1: Age between 2-5years (n=34; male: 15, female: 19)
- Group 2: Age between >5-15 years (n=66; male: 32, female: 34)
| Group | Step | Chi-square | df | p value |
|---|---|---|---|---|
| *p<0.05 considered as statistically significant | ||||
| Group 1 | Step 1 | 2.041 | 1 | 0.153 |
| Group 2 | Step 1 | 27.294 | 1 | 0.000* |
In group 1, z-score for weight-for-age was taken as independent variableLogistic regression model was statistically not significant with Χ2(1)=2041; p=0.153 ( Table 4 ). The model explained 7.9% (Nagelkerke R2) of the variance in dengue severity and correctly classified 67.6% of cases as given in Table 5 and Table 6 respectively. In group 2, z-score for BMI-for-age was taken as the independent variable. Logistic regression model was statistically significant with Χ2(1)=27.294; p=0.000 ( Table 4 ). The model explained 45.7% (Nagelkerke R2) of the variance in dengue severity and correctly classified 86.4% of cases as given in Table 5 and Table 6 respectively.
| Group | Step | -2 Log likelihood | Cox & Snell R Square | Nagelkerke R Square |
|---|---|---|---|---|
|
aEstimation terminated at iteration number 3 because parameter estimates changed by less than 0.001. bEstimation terminated at iteration number 5 because parameter estimates changed by less than 0.001. |
||||
| Group 1 | 1 | 43.193a | 0.058 | 0.079 |
| Group 2 | 1 | 62.007b | 0.339 | 0.457 |
| Group | Step | Observed | Predicted | |||
|---|---|---|---|---|---|---|
| Severity of dengue | Percentage correct | |||||
| Non-severe dengue | Severe dengue | |||||
| aThe cut value is 0.500 | ||||||
| Group 1 | Step 1 | Severity of dengue | Non-severe dengue | 19 | 2 | 90.5 |
| Severe dengue | 9 | 4 | 30.8 | |||
| Overall percentage | 67.6 | |||||
| Group 2 | Step 1 | Severity of dengue | Non-severe dengue | 36 | 3 | 92.3 |
| Severe dengue | 6 | 21 | 77.8 | |||
| Overall percentage | 86.4 | |||||
| Group | Step | Variable entered | B | S.E. | Wald | df | Sig. | Exp(B) | 95% CI for Exp(B) | |
|---|---|---|---|---|---|---|---|---|---|---|
| Lower | Upper | |||||||||
| *p<0.05 is considered significant | ||||||||||
| Group 1 | Step 1 | z-score for Weight-for-age | 0.403 | 0.292 | 1.910 | 1 | 0.167 | 1.497 | 0.845 | 2.652 |
| Constant | -0.419 | 0.364 | 1.321 | 1 | 0.250 | 0.658 | ||||
| Group 2 | Step 1 | z-score for BMI-for-age | 1.025 | 0.255 | 16.194 | 1 | 0.000* | 2.786 | 1.691 | 4.589 |
| Constant | -0.550 | 0.323 | 2.893 | 1 | 0.089 | 0.577 | ||||
In group 1, the estimated odds ratio of 1.497 indicates that higher z-score for weight-for-age is more likely to have severe dengue but it is not statistically significant (p=0.167). In group 2, the estimated odds ratio of 2.786 (Exp(B)) indicates that the higher BMI-for-age children were more likely to develop severe dengue than the lower BMI-for-age children (p=0.000).
Discussion
Previous meta-analyses have shown conflicting results regarding the association between obesity and severe dengue [9]. Study conducted by Chen et al [10] shows that obesity can predict an unfavorable outcome in dengue infection, with overweight patients being 50% more likely to develop severe manifestations. A few other studies have also reported that higher body weight increases the risk of developing severe dengue during the course of illness and lower body weight as being malnourished and/or underweight, seem to protect such children from developing severe dengue [11,12,13]. In our study, most of the dengue effected children were either underweight or normal weight. It can be postulated that the children with better nutritional status having BMI>23 may less likely develop the disease itself. However, among underweight and normal weight category in our study, those having higher z-scores for weight-for-age and BMI-for-age are having more likely chance to develop severe dengue ( Figure 2 , Table 7 ).
Theoretically, higher BMI may affect the dengue severity through the inflammatory pathways. Increased deposition of white adipose tissue in such individuals is attributed to increased levels of inflammatory mediators. These mediators in turn cause leakage of plasma as a result of increase in capillary permeability [14,15,16].
Risk of mortality due to dengue infection can be reduced with early identification of risk factors, prompt diagnosis and timely supportive care. Collecting anthropometric data (height, weight and body mass index) as a part of routine clinical examination at the time of patient admission helps to analyze the nutritional status of the effected children which can be utilized as a marker to predict if such cases may develop severe dengue in spite of receiving treatment [17].
Our study results showed that effected children having higher weight or BMI for their age and gender were found to be having severe dengue infection, though they belonged to underweight and normal weight BMI category.
Limitations of the study
There are few limitations in our study. Firstly, it was a retrospective collection of data. Secondly, the cases included were less. Thirdly, limited cases in overweight and obese category for which we cannot draw any inference in these categories.
Conclusion
The study was designed to understand how varying levels of body mass can influence the outcome of dengue infection in children. Looking at the case profiles of children, it can be postulated that good nutritional status of the child is protective in development of dengue infection per se. Nevertheless, the study results reveal that among the underweight and normal weight children, the chances of developing severe dengue is more in children with higher weight and BMI for their age and gender.
References
- World Health Organization. Dengue. Geneva: WHO. August 21, 2025. Available from: https://www.who.int/news-room/fact-sheets/detail/dengue-and-severe-dengue. Last accessed on 20th September 2025.
- Ajlan BA, Alafif MM, Alawi MM, Akbar NA, Aldigs EK, Madani TA. Assessment of the new World Health Organization's dengue classification for predicting severity of illness and level of healthcare required. PLoS Negl Trop Dis. 2019;13(8):e0007144. [Crossref] [Pubmed]
- Kaagaard MD, Matos LO, Evangelista MVP, Wegener A, Holm AE, Vestergaard LS, Do Valle SCN, Silvestre OM, Lacerda MVG, de Souza RM, Barreto Dos Santos F, Biering-Sørensen T, Brainin P. Frequency of pleural effusion in dengue patients by severity, age and imaging modality: a systematic review and meta-analysis. BMC Infect Dis. 2023;23(1):327. [Crossref] [Pubmed]
- Elmy S, Arhana BN, Suandi IK, Sidiartha IG. Obesity as a risk factor for dengue shock syndrome. Sari Pediatri. 2009;11(4):238-248. [Crossref]
- Indian Academy of Pediatrics Growth Charts Committee; Khadilkar V, Yadav S, Agrawal KK, Tamboli S, Banerjee M, Cherian A, Goyal JP, Khadilkar A, Kumaravel V, Mohan V, Narayanappa D, Ray I, Yewale V. Revised IAP growth charts for height, weight and body mass index for 5- to 18-year-old Indian children. Indian Pediatr. 2015;52(1):47-55. [Crossref] [Pubmed]
- Khadilkar V, Shah N, Harish R, Ayyavoo A, Bang A, Basu S, Chatterjee S, Chhatwal J, Elizabeth KE, Ghate S, Gupta A, Kinjawadekar U, Kumar R, Mishra S, Sakamuri K, Saxena V, Singh H, Singh P, Sud A, Tiwari S. Indian Academy of Pediatrics revised guidelines on evaluation, prevention and management of childhood obesity. Indian Pediatr. 2023;60(12):1013-1031. [Crossref] [Pubmed]
- Hadinegoro SR. The revised WHO dengue case classification: does the system need to be modified? Paediatr Int Child Health. 2012;32 Suppl 1(s1):33-38. [Crossref] [Pubmed]
- World Health Organization. Child growth standards. Geneva: WHO. Available from: https://www.who.int/tools/child-growth-standards/software. Last accessed on 20th September 2025.
- Zulkipli MS, Dahlui M, Jamil N, Peramalah D, Wai HVC, Bulgiba A, Rampal S. The association between obesity and dengue severity among pediatric patients: A systematic review and meta-analysis. PLoS Negl Trop Dis. 2018;12(2):e0006263. [Crossref] [Pubmed]
- Chen CY, Chiu YY, Chen YC, Huang CH, Wang WH, Chen YH, Lin CY. Obesity as a clinical predictor for severe manifestation of dengue: a systematic review and meta-analysis. BMC Infect Dis. 2023;23(1):502. [Crossref] [Pubmed]
- Junia J, Garna H, Setiabudi D. Clinical risk factors for dengue shock syndrome in children. Paediatrica Indonesiana. 2007;47(1):7. [Crossref]
- Tantracheewathorn T, Tantracheewathorn S. Risk factors of dengue shock syndrome in children. J Med Assoc Thai. 2007;90(2):272-277. [Pubmed]
- Pichainarong N, Mongkalangoon N, Kalayanarooj S, Chaveepojnkamjorn W. Relationship between body size and severity of dengue hemorrhagic fever among children aged 0-14 years. Southeast Asian J Trop Med Public Health. 2006;37(2):283-288. [Pubmed]
- Bosch I, Xhaja K, Estevez L, Raines G, Melichar H, Warke RV, Fournier MV, Ennis FA, Rothman AL. Increased production of interleukin-8 in primary human monocytes and in human epithelial and endothelial cell lines after dengue virus challenge. J Virol. 2002;76(11):5588-5597. [Crossref] [Pubmed]
- Juffrie M, Meer GM, Hack CE, Haasnoot K, Sutaryo, Veerman AJ, Thijs LG. Inflammatory mediators in dengue virus infection in children: interleukin-6 and its relation to C-reactive protein and secretory phospholipase A2. Am J Trop Med Hyg. 2001;65(1):70-75. [Crossref] [Pubmed]
- Calabro P, Chang DW, Willerson JT, Yeh ET. Release of C-reactive protein in response to inflammatory cytokines by human adipocytes: linking obesity to vascular inflammation. J Am Coll Cardiol. 2005;46(6):1112-1113. [Crossref] [Pubmed]
- Maneerattanasak S, Suwanbamrung C. Impact of nutritional status on the severity of dengue infection among pediatric patients in southern Thailand. Pediatr Infect Dis J. 2020;39(12):e410-e416. [Crossref] [Pubmed]